Record Fourth Quarter Contributes to 24 Percent Year-Over-Year Annual Growth
Adobe on Friday reported financial results for its fourth quarter and fiscal year 2019 ended Nov. 29, 2019.
“Adobe’s phenomenal performance in Q4 capped a record fiscal 2019 with revenue exceeding $11 billion. Adobe’s vision, category leadership, continuous product innovation and large and loyal customer base position us well for 2020 and beyond,” said Shantanu Narayen, President and CEO, Adobe.
“Adobe delivered another year of strong revenue growth and expanding profitability resulting in record earnings,” said John Murphy, Executive Vice President and CFO, Adobe.
“We are bullish about our opportunities and our ability to continue to deliver strong top- and bottom-line growth,” he said.
Fourth Quarter Fiscal Year 2019 Financial Highlights
Adobe achieved record quarterly revenue of $2.99 billion in its fourth quarter of fiscal year 2019, which represents 21 percent year-over-year growth. Diluted earnings per share was $1.74 on a GAAP-basis, and $2.29 on a non-GAAP basis.
Digital Media segment revenue was $2.08 billion, which represents 22 percent year-over-year growth. Creative revenue grew to $1.74 billion and Document Cloud revenue was $339 million.
Digital Media Annualized Recurring Revenue (“ARR”) grew to $8.40 billion exiting the quarter, a quarter-over-quarter increase of $539 million. Creative ARR grew to $7.31 billion, and Document Cloud ARR grew to $1.09 billion.
Digital Experience segment revenue was $859 million, representing 24 percent year-over-year growth.
Fiscal Year 2019 Financial Highlights
Adobe achieved record annual revenue of $11.17 billion in fiscal year 2019, representing 24 percent year-over-year growth.
The company reported annual GAAP diluted earnings per share of $6.00 and non-GAAP diluted earnings per share of $7.87.
Digital Media segment revenue was $7.71 billion, with Creative and Document Cloud achieving record annual revenue of $6.48 billion and $1.22 billion, respectively. Digital Media ARR grew by $1.69 billion during the year.
Adobe, a US-based company focuses on the creation of multimedia and creativity software products.
True Influence, the technology leader of intent-based marketing and demand generation solutions, on Friday announced its IntentBase intent data feed that provides B2B marketer, data and IT with the identification of meaningful intent signals that represent real opportunities to engage and connect with a target audience.
“Quality intent data can be a powerful predictor of who is in a specific market and ready to buy, enabling organizations to improve the performance and success of their sales and marketing programs,” said Brian Giese, CEO, True Influence. “Our data covers the entire world wide web, researching intent across millions of accounts and locations, increasing the amount and quality of intent data that our users receive.”
True Influence’s intent data is more expansive than what’s available from data co-ops or single-source providers, providing a comprehensive base for the advanced intent analysis. Intent behavior is monitored by both executive and managerial customer personas to give a complete picture of organizational buying dynamics. Key features include:
Option of either domain intent data – company, URL, city, state, topic, intent score, and date, or contact intent data, which adds the hashed email, or contact data with specific contact information, which targets the exact email and the precise in-market contact (full name and position) showing activity relevant to your specific topics.
Exclusive True Influence Identity Graph technology that identifies intent signals absent from most other data streams.
Advanced triangulation based on dozens of variables pinpoints accounts, locations, and specific individuals who are expressing intent. This critical intent intelligence is either missing or ignored in most other data streams.
Buying groups or demand unit determination by customer persona automatically identifying individuals who match the criteria across any account list or audience segment in a comprehensive B2B contact database.
Artificial intelligence (AI), machine learning, and natural language processing identifies the precise person in-market and topical interests, and maps intent activity to True Influence’s more than 6,500 B2B topics. New topics can be added at any time.
True Influence’s B2B contact data undergoes rigorous quarterly maintenance that includes standardization, verification, deliverability, NCOA, and deceased processing. Additionally, all intent and contact information delivered by IntentBase is in full compliance with GDPR and other prevailing privacy regulations.
KMWorld announced its Readers’ Choice Awards for 2019, and Accusoft’s OnTask was selected as the best solution for workflow automation. The list includes products that are targeted at helping organizations achieve digital transformation and document automation objectives.
Each year KMWorld releases a list of key products that are noteworthy and groundbreaking. The KMWorld Reader’s Choice Awards 2019 aims to elevate innovative solutions that readers value. Accusoft’s OnTask was ranked best-in-class in the workflow automation category, but was also a finalist for best business process management solution.
Accusoft’s OnTask is a business process automation tool that standardizes workflow, collects data, and populates documents and forms. Designed to support today’s on-the-go teams, OnTask is a cloud-based and mobile-ready application.
OnTask provides a cost-effective and scalable way to build and standardize critical business processes for growing businesses. OnTask helps growing businesses transform tedious email and paper-based functions into efficient digital processes.
Founded in 1991, Accusoft is a software development company specializing in content processing, conversion, and automation solutions. From out-of-the-box and configurable applications to APIs built for developers, Accusoft software enables users to solve their most complex workflow challenges and gain insights from content in any format, on any device. Backed by 40 patents, the company’s flagship products, including OnTask, PrizmDoc Viewer, and ImageGear, are designed to improve productivity, provide actionable data, and deliver results that matter.
Determine, a Corcentric company, a leading global provider of SaaS Source-to-Pay and Enterprise Contract Lifecycle Management (ECLM) solutions, was ranked in nine categories in Spend Matter’s Q4 2019 SolutionMap released this month.
Determine, which was acquired by Corcentric in April 2019, is recognized as a solution leader in Sourcing, as well as being included in the following categories: Supplier Relationship Management and Risk; Strategic Procurement Technologies (Sourcing, Analytics, CLM, and SRM); Spend and Procurement Analytics; Source-to-Pay; Procure-to-Pay; Invoice-to-Pay; E-Procurement; and Contract Lifecycle Management.
“It’s a privilege to be recognized by Spend Matters in their latest SolutionMap,” said Joe Payne, Senior Vice President, Corcentric. “Our Corcentric and Determine teams have worked hard to integrate our products and offer a full spectrum of Source-to-Pay and Contract Lifecycle Management solutions for companies in North America and Europe. It’s great to see that hard work reflected in these rankings.”
The SolutionMap considers over 1,000 functional and platform components across the source-to-pay and services procurement modules and suites in its rankings. The benchmarks are updated quarterly and reflect different organizational needs, making the rankings both timely and relevant to aid procurement professionals in selecting their best-fit procurement technology provider.
“SolutionMap is the great equalizer between buyers and sellers of procurement technology solutions,” says Spend Matters Founder Jason Busch. “It is the only ratings methodology that is fully transparent, considers equal parts technology analyst and customer scoring (individually and separately), and allows business users to create a one-to-one map based on their requirements to what technology vendors can provide based on demonstrated generally available capability.”
“We greatly appreciate the time and resources the analysts and our customers put into making these evaluations possible,” added Matt Clark, president and COO, Corcentric. “Companies of all sizes, locations and industries are reaping the benefits our newly combined service offering.”
Write in to psen@martechseries.com to learn more about our exclusive editorial packages and programs.
1010data, a leading provider of analytical intelligence and consumer transaction data, released the third in a series of holiday reports, Black Friday 2019: Is Online Shopping Sounding the Death Knell For Black Friday?
This study, which utilizes 1010data’s Card panel of over 5 million consumers, examines and analyzes the data relating to changes in Black Friday and Thanksgiving week sales in 2019—not only overall online sales growth, but the spread of sales over days and, more significantly, channels.
“Whether in-store or online, the winners in retail will be those that continue to evolve their shopping experiences to meet the way the consumer navigates the path to purchase.”
The Blurring of Black Friday Sales over the preceding week.
Growth by Channel: In-store sales may be down, but not overall sales.
Which retailers dominated? And by how much?
How Pre-Gaming Promotions are Affecting the Black Friday Shopping Experience: more blurring of channels and shopping days.
The Online Push: How retailers are responding
“While overall Black Friday sales held to similar levels year over year, representing almost 30 percent of the week’s sales, share of in-store channel has dropped from an average of 83 percent of spend for November, 2014 to an average of 68 percent in November 2019, a fall of 15 percent of channel share,” notes Andy Mantis, Chief Business Officer of 1010reveal.
“Whether in-store or online, the winners in retail will be those that continue to evolve their shopping experiences to meet the way the consumer navigates the path to purchase,” he said.
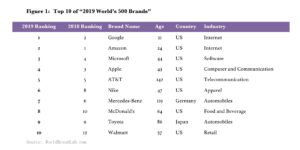
World Brand Lab today released its “2019 World’s 500 Most Influential Brands” list. Benefiting from business growth in cloud computing and self-driving technology, last year’s runner-up Google beat Amazon to top the list while Amazon dropped to second place.
Microsoft, which saw a sharp increase in net profit last year, ranked third. China has only 40 brands selected, which does not match its status of the second-largest economy. Among the prominent Chinese brands are State Grid, Tencent, China Life, China Resources, Changhong, Tsingtao Brewery, Sinochem, Wuliangye, Air China, CASIC, Hengli, China Everbright Group, and XCMG.
World Brand Lab
Based on global influence, the ranking of the World’s 500 Brands has been released for 16 consecutive years. Brand influence refers to the ability of a brand to enter a market, capture market shares and earn profits. Following three key indicators of brand influence—Market Share, Brand Loyalty and Global Leadership, World Brand Lab tracked more than 80000 famous brands around the globe and eventually launched the World’s 500 Most Influential Brands list.
The 2019 World’s 500 Brands list includes brands from 29 countries. The U.S. represents 208 out of the top 500, retaining its position as the brand superpower. UK and France, have 44 and 43 brands, respectively, ranking second and third. Japan, China, Germany, Switzerland, and Italy represent the second tier of brand powerhouses, with 42, 40, 27, 21, and 14 brands, respectively. Although 40 brands are selected from China, Chinese brands are still in the “third world”, despite the country’s 1.3 billion population and its status as the second-largest economy in the world.
Thirty-five brands are new to the list this year. These brands are scattered across various countries. Among the newly listed brands, China Resources, is ranked 78th. With the mission of “leading business progress and creating better living together”, China Resources has been continuously innovating its business models and creating product and service brands, to effectively promote industrial development and contribute to improving the quality of public life. Other famous brands such as Martell, Daikin, and Costa were also on the list. Some Chinese brands that are new to the list–China Everbright Group, XCMG, and Weiqiao–have made outstanding achievements in their respective fields, and these brands’ international reputation has been continuously improving.
H&M saw a continuous decline in sales, thus becoming the brand that fell the most this year. The automotive industry is experiencing trouble with the largest declines, with General Motors, Nissan, and Tesla ranking third, eighth, and ninth, respectively. Dulux is a well-known paint brand of AkzoNobel. Its products are sold in 100 countries around the world. During the past year, there were some scandals regarding its environmental and corporate governance, which affected its brand value and directly led to dropping out of the list.
The average age of brands in the 2019 World’s 500 Brands list reached 101.93 years old, slightly higher than 100.14 of last year. 217 listed brands are more than a century old. The United States accounts for 40% with 90 brands. Oxford and Cambridge, are listed as the top two oldest brands.
Saint-Gobain Is the Longest Running Brand
France’s Saint-Gobain is the longest-running brand in the business world with 354 years in operation. Among the 40 brands from China, only Moutai, Tsingtao Brewery, Wuliangye, and Bank of China can boast more than 100 years in business. By industry, brands in the food and beverage industry are the oldest, with 29 selected brands over the age of 100.
Regarding the global brand competition in the digital age, Professor Adam Galinsky of Columbia Business School believes that “In the global marketplace, where brand competition is fierce, companies often face unexpected crises, often of their own making. How do we get the crisis back into its bottle and mitigate any brand damage? The key solution is a simple but profound one, offering a Quick, Open, Remorseful, Committing to change apology.” Professor Ziv Carmon of INSEAD comments that “I think the performance of American and Chinese brands deserves attention. The strength of French, British, Japanese, Italian and German brands is not surprising—their performance roughly corresponds to the size of their economies.”
Since 2013, World Brand Lab has tracked more than 80,000 major brands in 60 countries and has established the largest brand database in the world. World Brand Lab, the leading brand consulting, research and evaluation firm, is chaired by Professor Robert Mundell, 1999’s Nobel laureate in Economics, and is wholly owned by World Executive Group. World Brand Lab is dedicated to brand valuation, brand strategy, brand naming, brand design, and brand protection.
Resulticks, the world’s fastest-growing real-time conversation marketing solutions provider, today released an insightful research report titled “Evolving the Customer Experience”, analyzing U.S. consumer holiday shopping behaviors across brick-and-mortar and online retailers. Despite the focus in recent years on online shopping, the report reinforces the renewed relevance of the physical store and the omnichannel experience that retailers can provide.
In-Store Retail Shopping Is Truly Alive and Well
This holiday season, close to three-quarters (74%) of respondents says they still shop in physical stores as much or more than they did last year. Interestingly, nearly one in three (30%) cite enjoyment as a top reason to browse physical stores, indicating the importance of an immersive and enjoyable store experience to win over holiday shoppers.
The report also emphasizes the significance of the omnichannel experience, with consumers choosing to interact with both online and brick-and-mortar stores, sometimes simultaneously. Sixty percent of holiday shoppers say they check prices online while shopping in-store to confirm they are getting the best price, over half (51%) would ask the store to price-match a better deal online, and nearly three-quarters (74%) would buy something online if the price was lower than in-store. This means that even brick-and-mortar retailers need a strong online presence and strategy to interact positively with their customers, whether online or in-store.
Convenience and Personalization Matter
In terms of retail shopping experiences, consumers yearn for both convenience and personalization. Over half (55%) of respondents state they prefer to try on clothing or see the quality and features in person, and more than half (51%) prefer to avoid shipping costs and delivery times by taking items home immediately. Additionally, push notifications drive four-in-ten (43%) consumers to shop in-store and over half (54%) of this year’s holiday shoppers report they shop with retailers who accurately suggest products or provide relevant service recommendations tailored to their needs.
“As consumer holiday shopping behaviors continue to shift, retailers and brands must be equipped to provide the seamless omnichannel experience that consumers desire,” says Redickaa Subrammanian, Co-founder and CEO of Resulticks.
“The results of our study show that consumers want to be understood; if a brand can ensure the path to purchase is enjoyable, seamless and personalized, it can certainly have a positive impact on the retailer’s bottom line,” Subrammanian said.
Write in to psen@martechseries.com to learn more about our exclusive editorial packages and programs.
New Homenet Automotive Meta-Analysis Suggests Consumer Insights Hold Keys to Improving Digital Merchandising
Today, nearly all shopping for a vehicle begins online, equipping consumers with more information and access to inventory than ever before. However, while dealers recognize the need to capitalize on this evolving shopping pattern, a new meta-analysis from HomeNet Automotive reveals they struggle with how to differentiate their dealership and stand out from the competitive clutter online.
According to the meta-analysis, 83 percent of dealers believe they can increase margins or reduce days to sell by improving digital merchandising – how new and used vehicle inventory is presented to customers online – but just 12 percent believe they are doing enough to distinguish themselves.
“As the prevalence of shopping for and purchasing vehicles online continues to rise, how dealers merchandise their inventory and separate themselves from the competition will be vital to profitability long term,” said Russ Daniels, Director of Product Marketing for HomeNet and vAuto.
“This new meta-analysis offers a consolidated look at key consumer habits contributing to the growing importance of digital merchandising and provides actionable insights and best practices to help dealers build a strong online presence that will win over shoppers,” Daniels.
With 41 percent of car buyers now only visiting one store, and 52 percent using multiple devices to get to a dealership’s website,2 the margin for error is becoming increasingly small for dealers when it comes to reaching the right customers at the right time with a website that is responsive and widely compatible. In order to implement an effective digital merchandising strategy that meets these emerging trends head-on, dealers must embrace technology and align their approach with consumer behavior and preferences.
Ultimately, the meta-analysis uncovered the following five opportunities for dealers to create more comprehensive, engaging digital listings that drive greater transparency and visibility amid a competitive market.
Introduce dynamic visual content to listings: While the impact of video has reached unprecedented levels of influencing shopper behavior – 90 percent of consumers in a 2016 survey said a video is helpful in the decision-making process – other new forms of elevating a vehicle’s visual appeal, such as 360 displays, are also adding significant value for consumers. Incorporating 360 displays and video content in listings can help dealers optimize digital merchandising efforts, create differentiation and enable more informed purchase decisions. However, while 73 percent of consumers who browsed and then either bought or leased a vehicle perceived 360 displays as being extremely or very helpful, 42% of dealers have indicated they never merchandise with these displays.
Exchange stock photos for multiple custom ones: Transparency in conveying a complete and comprehensive visual overview of a listing is key to effectively merchandising a vehicle online. According to the meta-analysis, 64 percent of car buyers want extensive vehicle data and photos. They want to see and fully understand what they are buying. In fact, while a single custom photo earned 166% more vehicle detail page (VDP) views per listing than a single stock photo, multiple custom photos earned 245% more VDPs per listing than multiple stock photos. What’s more, multiple custom photos earned 69% more VDPs per listing than a single custom photo. The more custom photos available on a listing, the better the shopping experience and engagement.
Leverage backgrounded images that keep the focus on the car: Backgrounded images that are clear and easy to digest receive up to 5 percent more click conversions from the search results page (SRP) to the VDP and can help boost buyer appeal and perceptions of the corresponding dealership. Utilizing photo overlays can also offer an easy way to deliver relevant content to shoppers, with the inclusion of dealership branding particularly effective on third-party websites.
Elevate vehicle information and descriptions: With the majority of shopping time spent online, it is becoming increasingly important for dealers to equip their digital listings with all the need-to-know information consumers have come to rely on to make faster, more confident decisions. Dealers can also build trust through transparency by giving shoppers access to complete car histories right as they research online.
Improve customer engagement and dealership reputation through third-party websites: According to the meta-analysis, 80% of consumers use third-party websites for shopping and research. It will therefore be crucial for dealers to develop an integrated marketing strategy to better reach and influence shoppers where they are online. Dealers should ensure they are featuring their listings on third-party websites and leveraging the growing popularity of Facebook Marketplace as a new destination for used car listings.
The Automation Software Market is expected to reach USD 11821.24 million by 2027 witnessing market growth at a rate of 11.05% in the forecast period 2020 to 2027, says latest business intelligence report Published by Data Bridge Market Research.
Growing demand for lead management and rising demand from BFSI sector are the factor for the market growth in the forecast period of 2020 to 2027.
Rising demand for tracking mechanism and growing need for streamline in the sales processes are the factor for the market growth. Advancement in the field of mobile telecommunication technology will also drive the market, the report says. The increasing popularity of cloud-based CRM technology will also affect the growth of the market positively. Growing demand to decrease the duration of the sales cycle is also anticipated to enhance the market growth. There is also a growing demand for business intelligence & insights, which will also affect the growth of the Sales Force Automation Software Market in the forecast period of 2020 to 2027.
Major Industry Competitors: Sales Force Automation Software Market
The major players covered in the Sales Force Automation Software Market report are Aptean, Creatio, Infor, Oracle, Pegasystems Inc., SAP, Salesforce.com, inc., SugarCRM., Zoho Corporation Pvt. Ltd., Bullhorn, Inc., Microsoft, Technology Group International., ACG Infotech Ltd., Ayoka, L.L.C, Consensus Sales, Inc., eLeader., Senior Software, TechManyata Software Solutions Pvt. Ltd., among other players domestic and global. Market Share data is available for Global, North America, Europe, Asia-Pacific, Middle East and Africa and South America separately. DBMR analysts understand competitive strengths and provide competitive analysis for each competitor separately.
Sales Force Automation Software Market is segmented based on application, deployment type, industry vertical, organization type, and software. The growth among segments helps you analyse niche pockets of growth and strategies to approach the market and determine your core application areas and the difference in your target markets.
Sales Force Automation Software Market competitive landscape provides details by a competitor. Details included are company overview, company financials, revenue generated, market potential, investment in research and development, new market initiatives, regional presence, company strengths and weaknesses, product launch, product width and breadth, application dominance.
Why Is Data Triangulation Important In Qualitative Research?
This involves data mining, analysis of the impact of data variables on the market, and primary (industry expert) validation. Apart from this, other data models include Vendor Positioning Grid, Market Time Line Analysis, Market Overview and Guide, Company Positioning Grid, Company Market Share Analysis, Standards of Measurement, Top to Bottom Analysis and Vendor Share Analysis. Triangulation is one method used while reviewing, synthesizing and interpreting field data. Data triangulation has been advocated as a methodological technique not only to enhance the validity of the research findings but also to achieve ‘completeness’ and ‘confirmation’ of data using multiple methods.
Award derived from sentiment ratings provided by TTEC employees
TTEC Holdings, a leading digital global customer experience technology and services company focused on the design, implementation and delivery of transformative solutions for many of the world’s most iconic and disruptive brands, today announced it has been named to the Best Company for Diversity 2019 list by Comparably, a leading workplace culture and compensation site.
Winning companies are based solely on how satisfied diverse employees based on ethnicity rank their workplaces, using questions based on a variety of workplace culture questions ranging from work environment to compensation to leadership. Comparably Awards are derived from sentiment ratings provided by employees who anonymously rated their employers on Comparably.com from November 19, 2018 through November 19, 2019. The final data set was compiled from 10 million ratings across 50,000 U.S. companies within the 12-month period.
“As a Latina, I’m proud that our employees recognize our commitment to foster and grow a diverse and inclusive culture where we celebrate our different perspectives and backgrounds,” said Judith Almendra Rodriguez, Vice President, Global Human Capital, Engagement and Talent Acquisition.
“As a global organization that manages millions of interactions with people in a year, we at TTEC believe that diversity is one of our greatest strengths. When everyone has the opportunity to contribute and take their career to the next level, we are able to deliver amazing experiences to clients, customers and employees alike,” she said.
“Employers who create workplaces that inspire, encourage and support all diverse voices and contributions are critical to business growth, creativity and innovation,” said Comparably CEO Jason Nazar.
“Our annual Best Companies for Diversity list highlights organizations that diverse employees have collectively given top marks on in important core culture metrics, including compensation, leadership, and career opportunities,” she added.
TTEC Holdings is a global customer experience (CX) technology and services company focused on the design, implementation and delivery of transformative customer experience, engagement and growth solutions.
We store cookies on your computer to improve your experience and provide more personalized services, both on this website and on other sites. For more information about the cookies we use, see our Privacy Policy. We won't track your information when you visit our site. We will have to use at least one cookie to ensure that you won't have to make this choice again.AcceptDeclinePrivacy Policy