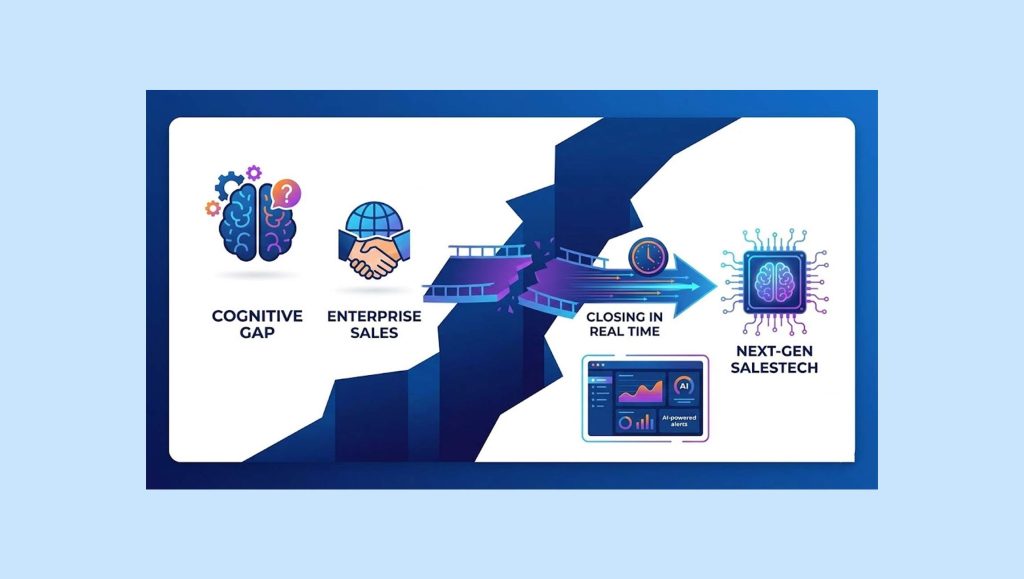
Any sales function demands trustworthy data. In today’s fast-paced data-driven economy that is buzzing with sophisticated competitors and intelligent customers, having access to quality real-time data can directly improve your chances of getting ahead in the race. Data visualization and BI tools for sales dashboards have become a proven arsenal to accelerate sales journeys through various means. Modern sales teams rely on real-time customer intelligence, data storytelling, interactive analytics, and sales performance optimization tools to effectively manage their processes. All these directly tie in with the sales dashboards, providing a quick overview of how each of these is performing.
In all these clutter, working with an interactive Sales dashboard can truly drive sales decisions. These dashboards are central features in any Sales Technology stack for unveiling new opportunities for growth.
So, what is a Sales dashboard?
A sales dashboard is a data visualization interface that represents your sales data. These visualizations can be filtered and customized based on unique preferences such as customer lifecycle, deal value, time and region, and revenue goals. There are over 100 metrics in an advanced sales dashboard that include Quota Attainment, Sales Rep Performance, Call Analytics, Average Deal Size, Sales Funnel Status, and so on.
Any Sales dashboard could be classified based on the Key Performance Indicator (KPI) it represents. Some dashboards could provide two or more KPIs in the same interface, enabling SalesTech users to drill down deeper into the critical aspects of their sales processes.
Recommended Blog: What Is A Chatbot For Sales: Why Sales Technology Is Incomplete Without Chatbots?
The most advanced sales dashboards could be classified into one or more of these categories:
• Sales Rep Recruitment and Performance
• Sales Technology Effectiveness Metrics
• Sales Activity Analytics
• Sales Outreach Metrics
• Sales Enablement, Training and Onboarding
• Lead Generation and Account Intelligence
• Revenue Leakage and Competition Analytics
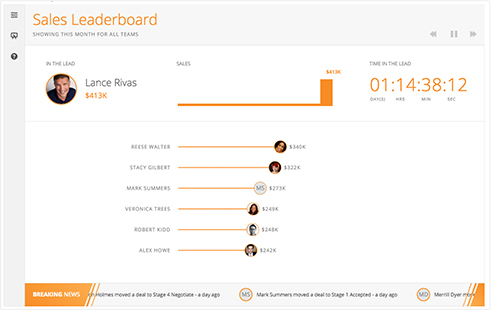
• Sales Leaderboard
• Deal Tracker and Forecasting
• Sales Product
Here are some leading data visualization software providers that excel in sales dashboards.
-
Klipfolio
Klipfolio is a leading business dashboard software provider. For sales, Klipfolio dashboards allow you to create a unique sales report. It includes a combination of charts, graphs, and other powerful data visualization tools and infographics to meet the exact Sales and Revenue needs.


iDashboards
iDashboards is an intuitive platform for Sales dashboards. They provide self-service dashboard software that could empower SalesTech users to create engaging and meaningful Sales dashboards. Some dashboards require minimal or no coding, allowing reps to directly drive in their sales reports from excel spreadsheets and CRMs.
Read Also: 10 Sales Technology Options You Must Know In 2019
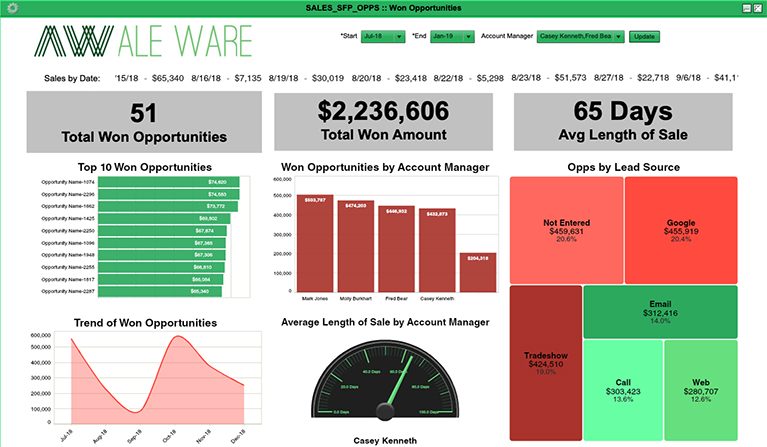
By leveraging Connect iDashboards with your data sources, including Excel spreadsheets, SQL databases, and a multitude of cloud applications, SalesTech users can easily build charts using a mix of data sources in a single dashboard and spot hidden trends at a glance to make more informed decisions.
Databox
Databox provides unique Sales dashboard featuring all your key sales metrics front in one window. Whether it’s Salesforce or any other data warehouse, creating optimized sales dashboard with Databox is a cakewalk for sales teams.
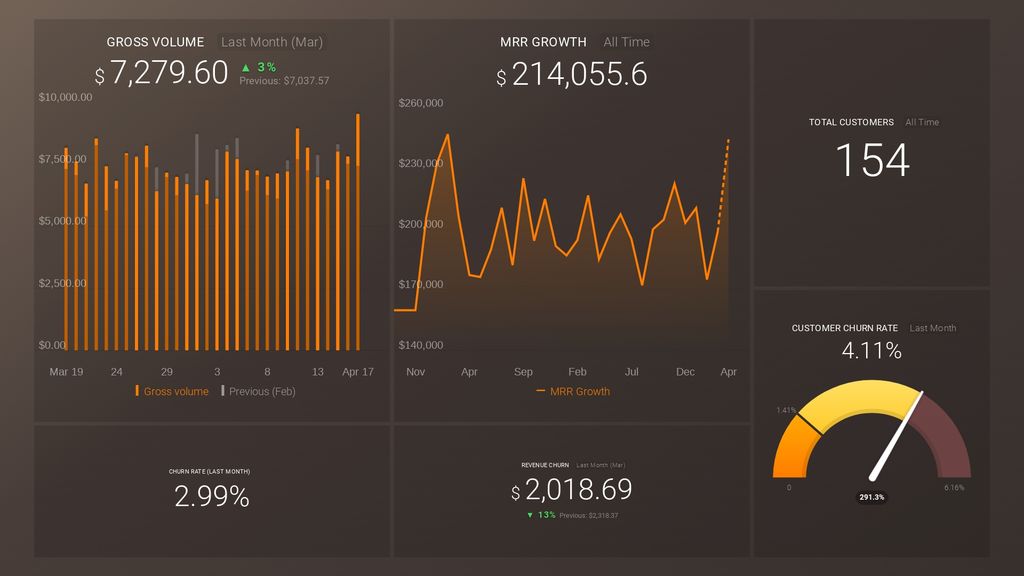
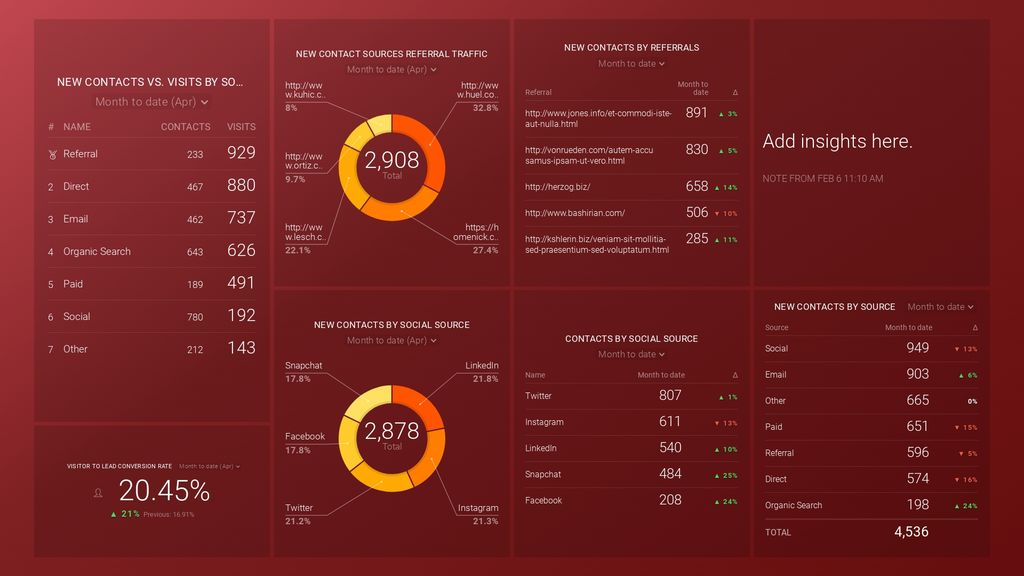
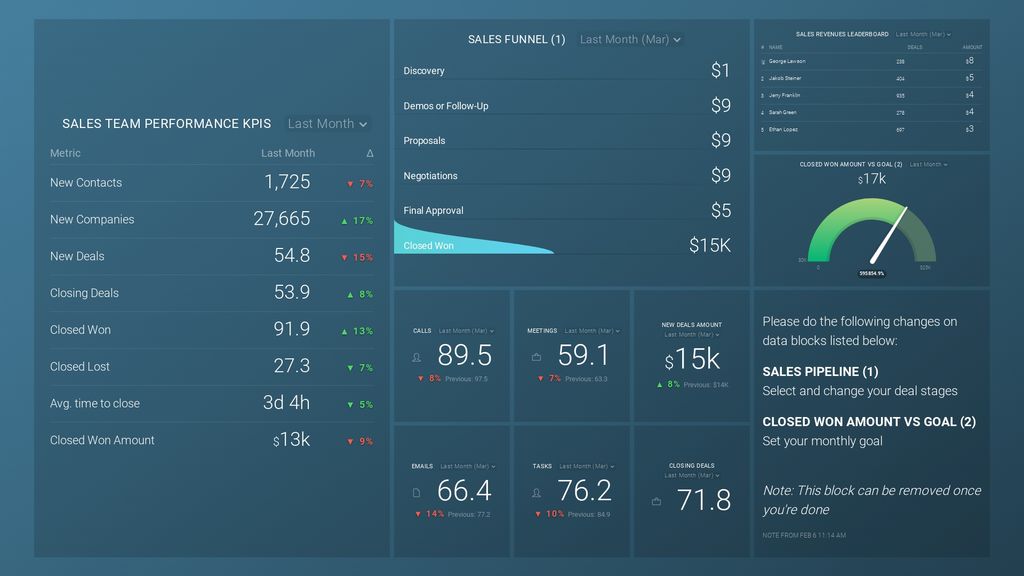
Currently, Databox provides 200+ pre-built reports, 65+ one-click integrations and a powerful DIY dashboard with no-code simplicity. Sales teams can easily connect any data with Databox and hook up on multiple sources in a breeze.
Slemma
For those who feel pre-builts aren’t enough to match the competition in sales dashboards, here is a good option. It’s Slemma – a powerful BI tool for dashboard analytics and intelligence that is already leveraged by leading SalesTech providers and customers. It is an adaptable data visualization platform for dashboards and chart designs.
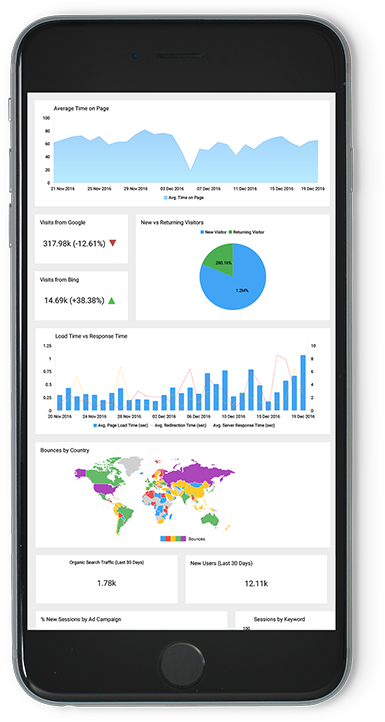
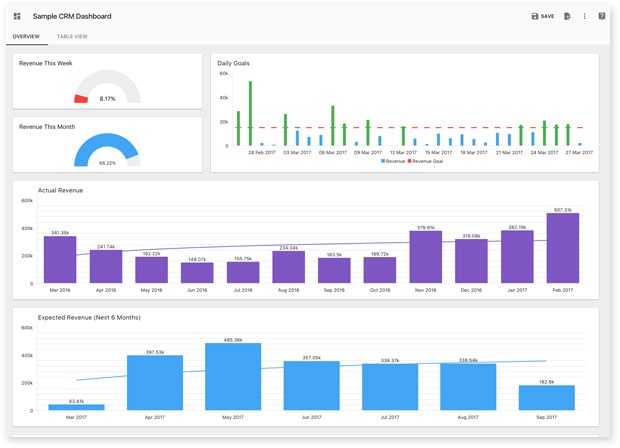
Slemma is as minimal as it gets – yet it packs a punch with powerful integrations to quickly configure access to a number of datasets, allowing teams to share dashboards with everyone in the company and with customers.
Domo
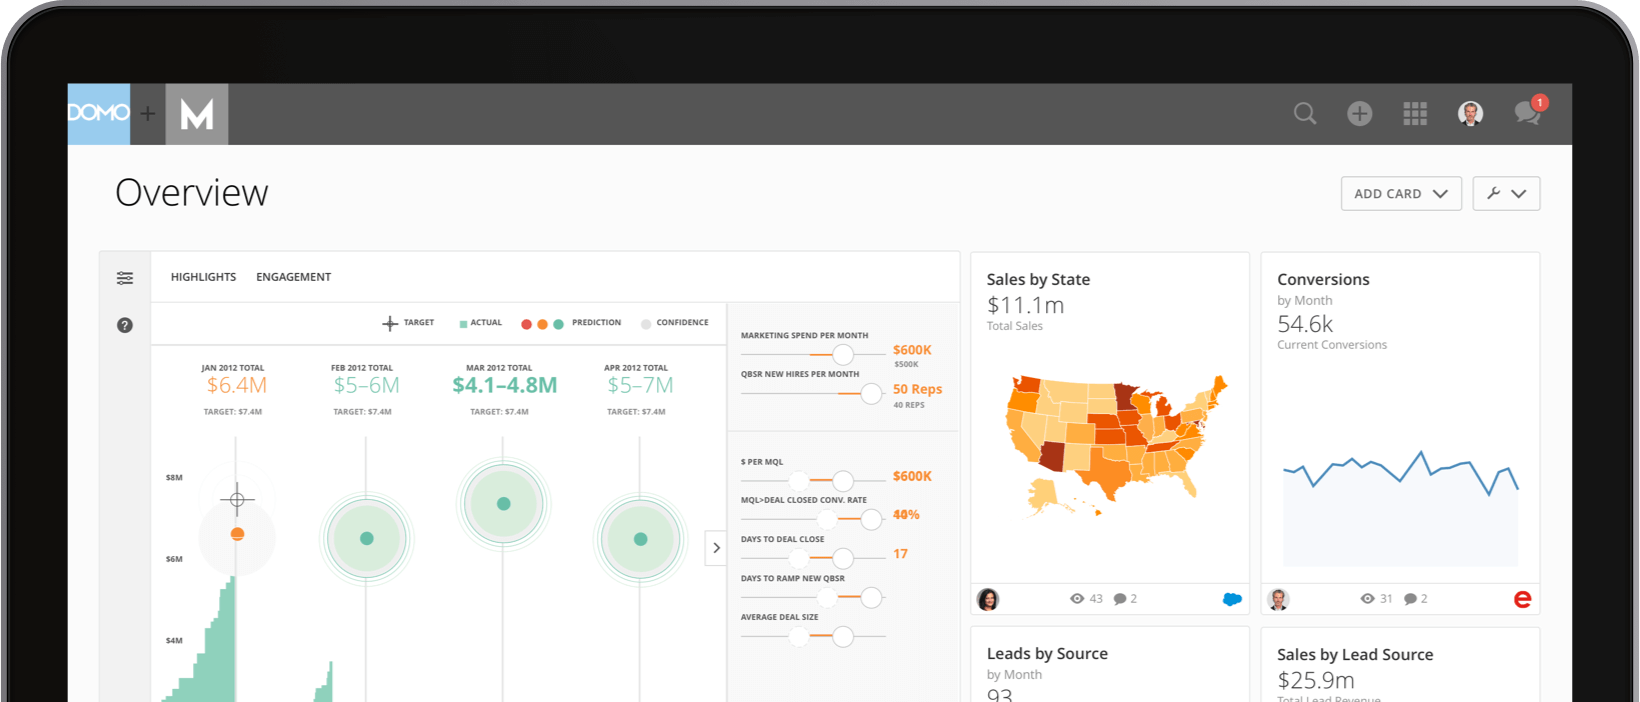
To run a better sales org, you need to empower the sales leadership with real-time insights on how every rep is performing. Domo’s sales dashboards bring all the critical sales information in one place so you can accurately view and analyze how your metrics are performing. From getting your sales team to speed up, to fostering a healthy data-driven relationship internally and with customers, Domo’s sales dashboards are built to improve pipeline management, to manage sales opportunities and to improve forecasting with predictive intelligence for every point in the sales funnel.
SAP Lumira
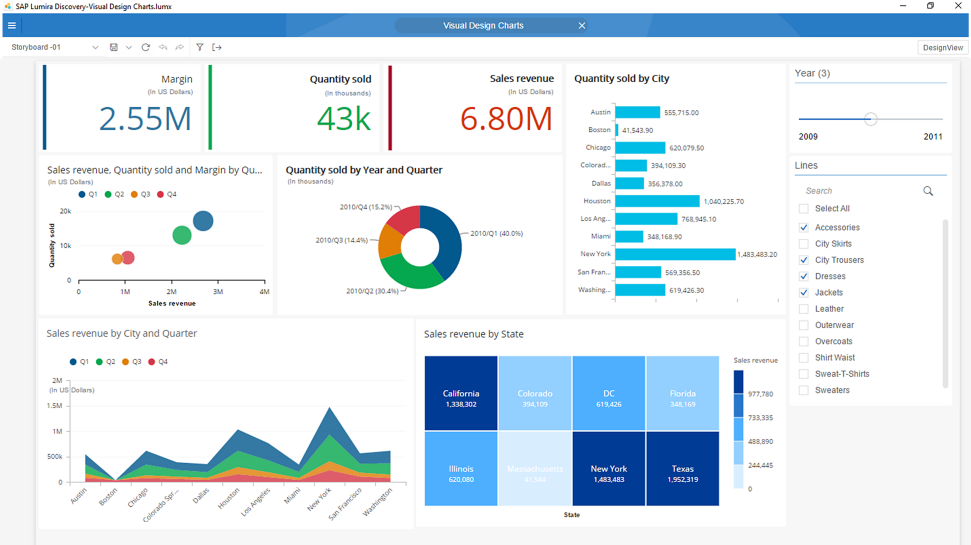
If you are a data visualization fanatic, you can’t miss out on SAP Lumira’s unique features that bring data to life. For a sales org that is still very new to building data-focused reports and charts, it could get very complex. It is initially hard to search a Sales dashboard that could exactly deliver on your needs. It could also mean shelling out tons of dollars in understanding the truly relevant analytics and platform capabilities without really finding the best-to-use platform for Sales dashboards.
For such users, SAP Lumira solves the problem by aptly and maturely connecting to sales spreadsheets or databases (from both offline and online), and merging them at a single destination.

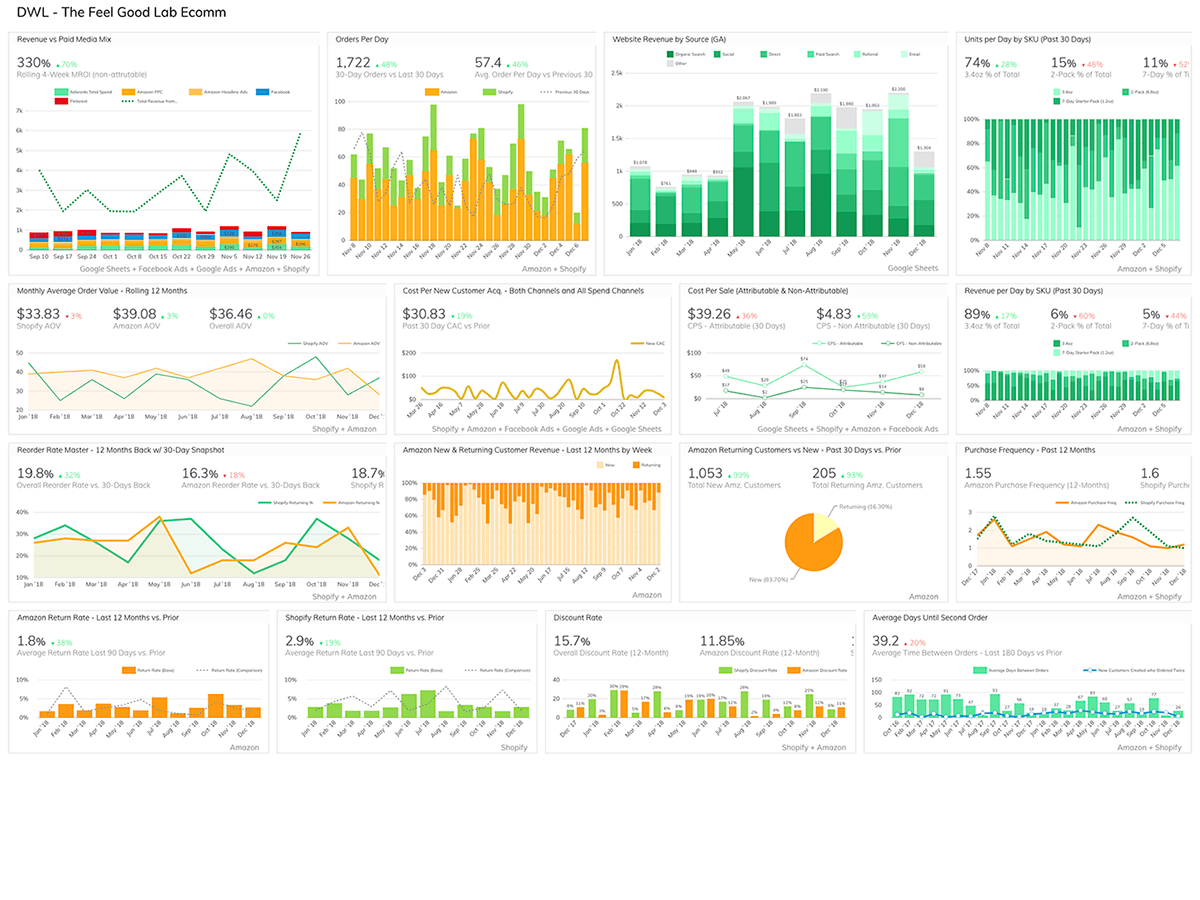
Grow.com
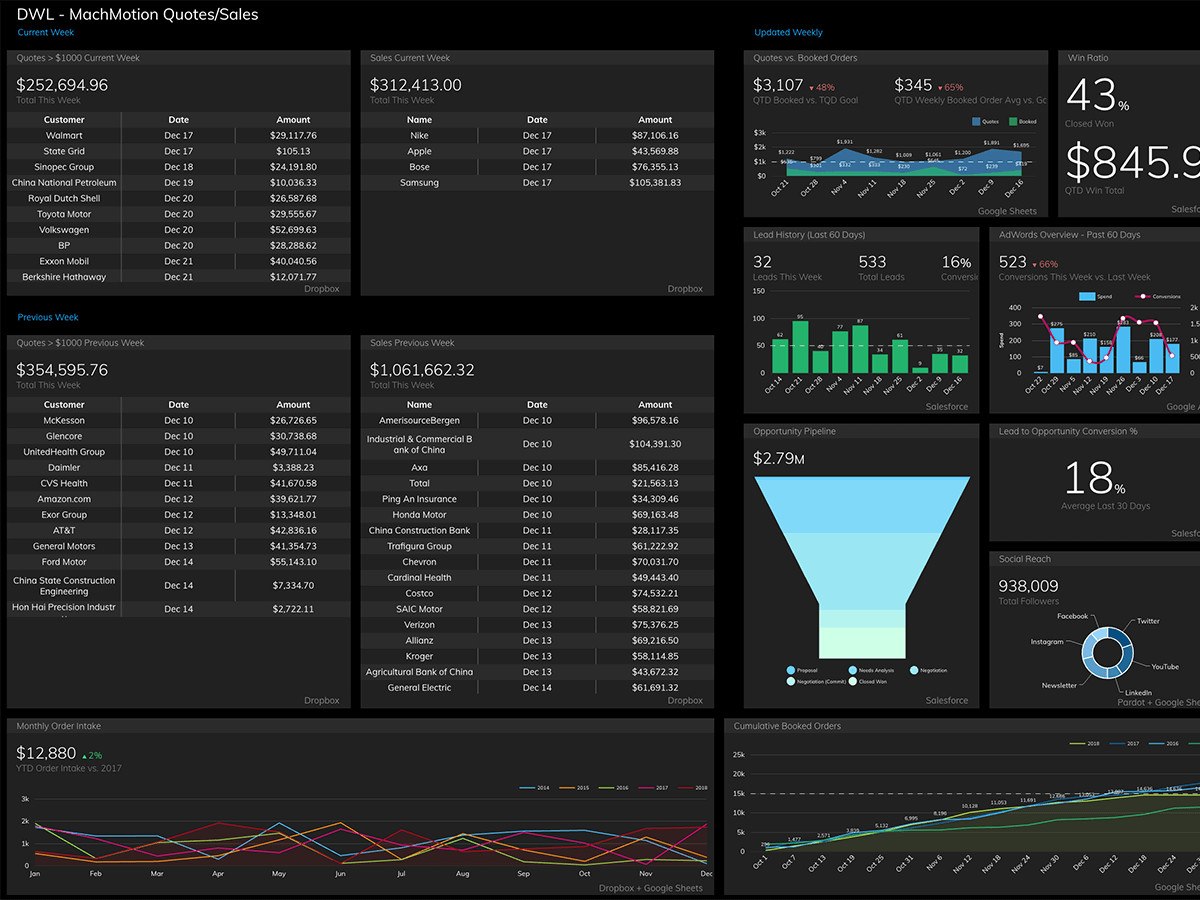
Sales dashboards from Grow.com make it to our list of coolest BI tools by virtue of their speed, ease, and effectiveness in generating meaningful reports. Grow is certainly changing the paradigm of sales dashboards by providing a single-platform BI tool to solve all sales and marketing queries that often plague small and medium-sized companies.
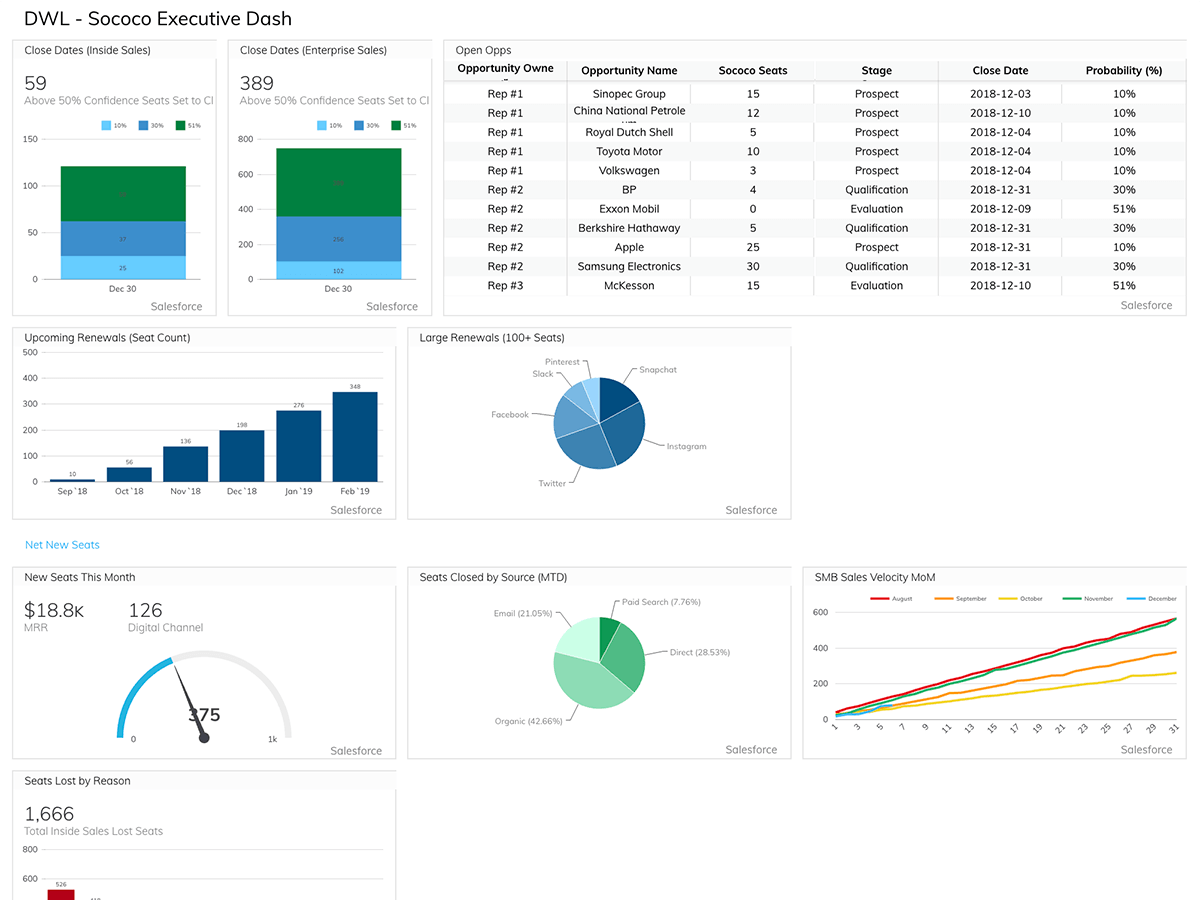
Yes, the most challenging part of working with a sales dashboard is understanding how it works. In order to truly understand the BI side of sales dashboards, you can start reading about top sales companies that leverage BI and data visualization tools for their operations.

