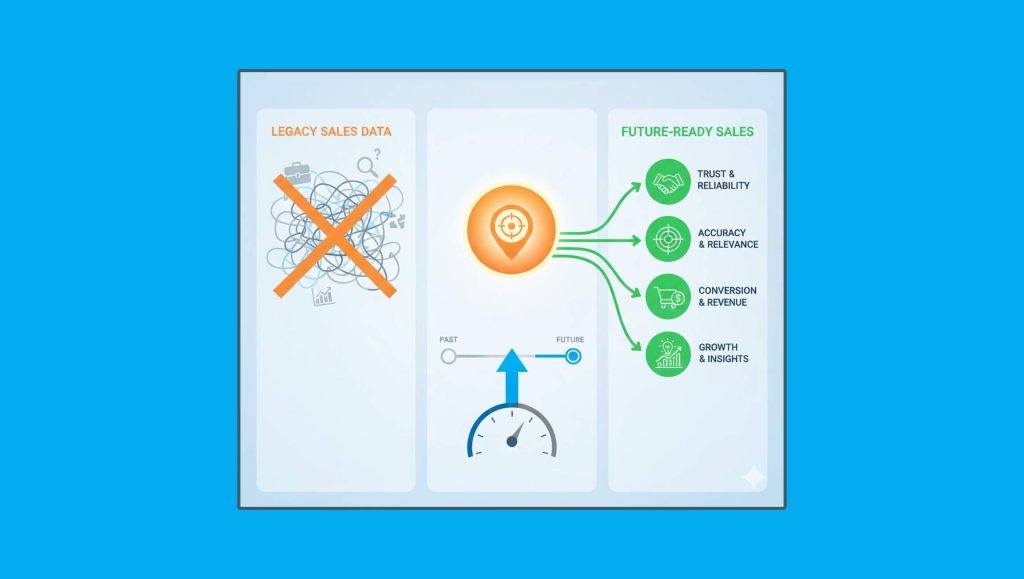
New functionalities include performance indicators and quota forecasting plus a set of visual aides to help sales leaders ascertain current and future performance trends
Pipeliner CRM today announced that it is launching the most comprehensive reporting and Analytics solution available to provide automatic, instant, actionable, and dynamic insights into past, current and future performance trends. New features allow sales professionals to take advantage of today’s digital transformation with enhanced reporting options for performance indicators and quotas, along with exceptional visual aides such as line graphs, bar and pie charts allowing for more intuitive analytics. In addition, the unique Power Panel feature in Pipeliner CRM enables users to view the data from different perspectives and set filters to isolate the important details and provide deeper analysis.
“The constant changes in today’s business world have increased the demands for the immediate delivery of data. Automation features and functions in Pipeliner CRM provides the means for sales teams to organize and interpret data so that leadership decisions can be made rapidly and accurately,” said Nikolaus Kimla, CEO of Pipeliner CRM. “Deep analytics with actionable insights can lead to more efficient and effective strategies to leverage opportunities and quickly understand indicators and performance.”
“Pipeliner is the only CRM that provides data in a fully visual form, without this instant dynamic visualization, sales leaders cannot easily identify the trends that will greatly impact their organizations,” continued Kimla.
Pipeliner CRM allows organizations to interpret data utilizing the four main types of analytics.
- Descriptive Analytics: “What Happened?” This includes data and reports that outline what has already transpired.
- Diagnostic Analytics: Why Did It Happen? This enables users to analyze why some deals have not been closed, or have even been lost.
- Predictive Analytics: What Could Happen? Once the data is analyzed, Pipeliner CRM analytics will offer sales pros a view of possible future performance.
- Prescriptive Analytics: What Should We Do? Prescriptive analytics provide a clear path forward for sales teams. The primary source of prescriptive indicators utilizes the Bubble Chart View which shows a multi-dimensional view of opportunities plotted by sales stage, closing date and size.
Performance Insights Provides Visibility into the Pipeline:
Pipeliner CRM is offering another new feature called Performance Insights, which provides organizations with visibility into the overall pipeline health including open versus lost opportunities. In addition, sales teams can filter the analytics in multiple ways including by User, Sales Unit and Pipeline level. This allows the organizations to have insight into the performance of both sales individuals and teams, providing analysis into, for example, the amount of leads that are being generated and created. As such, Pipeliner CRM will offer a complete performance overview, with leading and lagging indicators, insights, and overall performance. When sales teams leverage the Power Panel to filter the data, they can ascertain all of these factors by sales unit, product lines, type of sales or any other element.
The Performance function also enables the user to have insight into the following:
- Velocity: How fast a sales rep is closing an opportunity
- Conversions: This includes the conversion Rate and Average Win rate
- Win Probabilities: This helps determine the best chance of winning the opportunity in the particular step, compared to configured values in Admin
- Number of Qualified Leads
Quota Planning Has Been Added to the Pipeliner Forecasting Functionality:
Pipeliner CRM Forecast Reports provides a powerful means to set and track Quota achievement in real time. Reports can be shared only with specific team members, or across the whole sales unit, depending on preferences. Robust analytic tools also enable the full quota picture that offers a deep dive into the historical quotas as well as allows managers to update the quotas in bulk for the current year.
Overall, sales managers can perform the following functions:
- Set Quota period: Monthly, Quarterly, Yearly
- Set Quotas for either Sales Unit Quotas or Individual User Quotas
- Quotas Options:
- Custom: Allows the sales manager to define quotas for every sales rep manually
- Evenly: Based on Expected Quota, Pipeliner will split quota evenly among the sales reps
- New Forecast Graphs allows sales managers to visualize how far the team is from hitting an expected quota.


