Amid national labor shortage, consumers favor self-service over ordering from restaurant staff
Restaurant apps with missing menu items get deleted; Consumers prefer the drive-thru for mobile order pickup; Drive-thru visits remain high
Bluedot, a customer arrival platform that empowers brands to provide real-time interactions and pickup solutions, released the fifth installment of the State of What Feeds Us report which has kept tabs on consumer behavior and restaurant habits since the beginning of the health crisis. The findings have offered insight into consumer expectations to support restaurant brands as they work to navigate ongoing operating, social, and economic shifts over the past year and a half. The latest research was based on a survey of 1,508 American consumers.
Read More: SalesTechStar Interview With John Bruno, Vice President Of Strategy At PROS
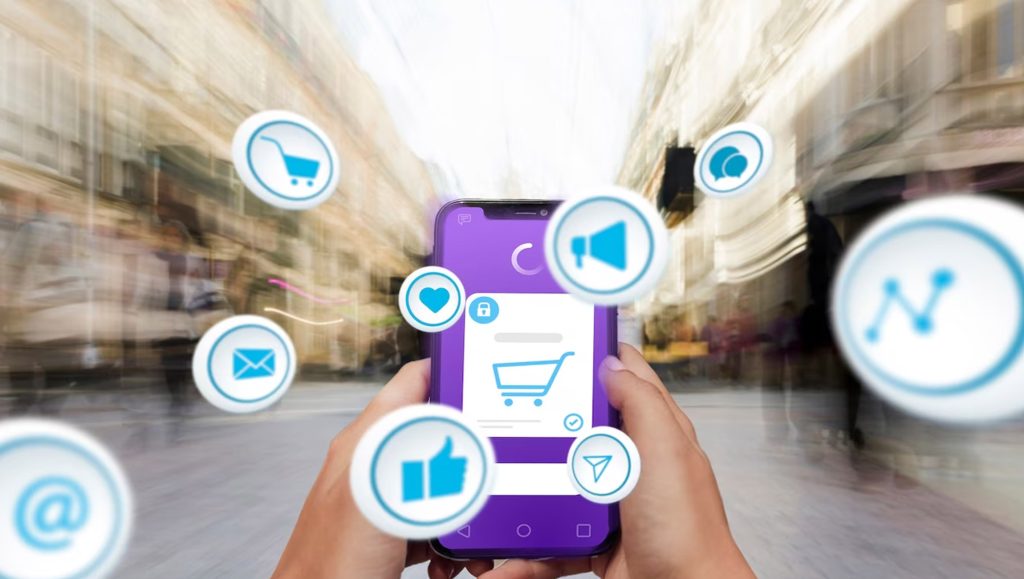
The new report captures a steady rise in mobile ordering, reinforcing the critical importance of mobile initiatives for restaurant brands. According to the data, consumers deleted restaurant apps if menu items were missing or if there was limited ability to customize orders. The data also points to a broken customer arrival experience. Participants indicated mobile order pickups often involved excessive wait times and flagging down staff.
The report also highlights that consumers favored self-service or digital ordering over ordering from restaurant team members, which for some brands could address the crippling labor shortage facing restaurants throughout the country. The data further signaled that price increases have had a significant impact on consumer restaurant habits. Nearly two-thirds (63%) of participants indicated they have ordered or visited less due to higher prices.
Intriguingly, it appears fast casual restaurants have started taking back the customers they lost to quick serve restaurants since the pandemic, with consumers visiting fast casual restaurants more often, up to 24% from 21% in May. Nevertheless, drive-thru visits remain high, at levels that have been broadly consistent since the pandemic.
“Rapidly adapting to pandemic and economic fluxes is a massive challenge for restaurants and the labor shortage compounds the problem. The only sustainable way to address the pain points is to rebalance digital and staffing resources by utilizing mobile strategies to alleviate stress in customer facing interactions while complementing those processes that are labor intensive,” said Judy Chan, Bluedot’s Chief Marketing Officer. “The report continues to signal rising consumer demand for better functionality, ease and convenience. This is an opportunity for brands to eliminate friction across the customer journey, from the moment an order is placed through to the moment a customer picks up their order. For restaurant brands, the digital pivot is imperative to getting the customer experience right.”
Highlights from the report include:
Mobile Apps
- Mobile orders are on the rise. One-third (35%) are placing more orders on restaurant apps compared to three months ago.
- App downloads remain strong. 59% downloaded at least one new restaurant app in the last three months.
- Customers are likely to spend more when ordering via restaurant apps. Respondents report they are likely to spend more money via mobile apps followed by the drive-thru and in-store. In May, the drive-thru ranked at the top.
- Missing menu items are a deal breaker. The top reasons why consumers delete restaurant apps include missing menu items (47%), order is cold (45%), still having to wait (42%), and it doesn’t save time (41%).
- Gaps in menu choices and ability to customize disappoint consumers. The majority (54%) state that mobile apps don’t offer a complete list of menu items or customization options.
- Restaurant apps reign supreme over third-party apps. More than half (57%) used mostly or all restaurant apps compared to third-party apps in the last month.
- Consumers want more mobile apps for local chain restaurants, but the apps must have easy ordering and easy payments. Consumers ranked local chains as their second most desired type of apps and loyalty programs. Must haves for local chain restaurant apps include easy ordering (66%), easy payment (61%), loyalty/rewards points (52%), and coupons and/or deals (52%).
Mobile Order Pickup and the Arrival Experience
- For mobile pickups, consumers prefer the drive-thru. 39% ranked the drive-thru as their top mobile order pickup preference followed by in-store (31%) and curbside (30%).
- Drive-thru pickups suffer from multiple customer pain points. 38% of customers had to wait in the general drive-thru line when picking up their mobile order while 20% had to identify themselves at the speaker box with their name or order number. 12% stated that staff couldn’t match their mobile order and 8% were asked to pay for an order that wasn’t theirs.
- Consumers are flagging down staff and waiting in line for mobile orders inside restaurants. Of those who suffered from a poor experience upon arrival, 40% had to flag down staff to let them know they were picking up their order, 40% had to wait in the general order line due to no designated pickup, and 20% stated their order was missing from the pickup shelf.
- Curbside pickup relies on customer initiated interaction. The arrival experience for curbside pickups is still failing. When picking up curbside orders, 41% had to locate the app and tap a button on their phone to check-in while 31% called or texted upon arrival to notify staff. 12% walked to the mobile pickup area while 10% had to manually alert staff upon arrival.
- Wait time remains a problem. Top frustrations when picking up orders include: order isn’t ready and having to wait (46%), food is ready but still having to wait (44%), food is cold (36%), order is inaccurate (36%), and no designated mobile order pickup line (22%).
Read More: Metatron Releases Crypto Based E-Commerce App with Ketobodz…
Inflation and Pricing Concerns
- Consumers are ordering less. 63% of customers are impacted by recent price increases. 32% are ordering less at restaurants while 31% are visiting less often.
- Better prices could yield more app downloads. The vast majority (90%) would download and use a restaurant app more often if it meant access to better prices.
- Convenience holds more value for high income earners. 43% of high income earners say convenience is more top of mind than pricing.
Staffing
- Self-service ordering is preferred over ordering from restaurant staff. 43% prefer using their mobile phone when placing orders. 17% prefer using either their mobile phone or kiosk while 18% prefer speaking with a staff member.
Loyalty
- Loyalty programs yield repeat business. Two-thirds (69%) stated that loyalty programs incentivize them to revisit a store or restaurant more frequently.
- Points and rewards top reasons consumers join loyalty programs. One in two ranked points and/or dollars off for rewards as most important followed by coupons.
- Consumers equate loyalty programs with better service. As loyalty members, consumers state they receive personalized deals and coupons (45%), orders are available upon arrival (28%), they receive better pricing (26%), and they’re thanked for being a loyal customer (26%).
- Loyalty programs are most popular for fast food. Consumers are most interested in joining fast food loyalty programs compared to fast casual, local chains, etc.
Brand Engagement
- Consumers are snagging deals on social media. 52% say social media impacts their app downloads and usage. A quarter (27%) use social media to find deals and coupons.
- Gamification draws consumer engagement. 52% would be more likely to interact with a restaurant if the brand was offering a game or contest. 24% would download the brand’s app, 23% would order from the app, and 19% would join the brand’s loyalty program.
Fast Food
- Drive-thru visits remain high. 9 out of 10 consumers visited the drive-thru in the past month, remaining consistent with the last report findings in May.
Fast Casual
- Fast casuals are beginning to take back their customers. 43% visited mostly or all fast food restaurants compared to fast casuals in the past month, down from 45% in May. Visits to fast casual restaurants are increasing with 24% visiting mostly or all fast casuals compared to fast food restaurants last month, up from 21% in May. One-third visited fast food and fast casual restaurants equally.
- Uptick in curbside pickups. Nearly two-thirds (65%) utilized curbside pickups at fast casual restaurants in the past month, an increase from 60% in May.
- Most popular among higher income earners. Consumers who make over $50k (28%) visit more fast casual restaurants compared to those who make under $50k (19%).
Generational
- Social media heavily influences app downloads among Gen Z. The vast majority of Gen Z (71%) say social media impacts their app downloads and usage.
- Gen Z and Millennials download and keep restaurant apps for access to special menu items. Millennials (28%) and Gen Z (20%) download apps to access special menu items while 35% of Gen Z and 32% of Millennials keep restaurant apps to access special menu items.
- Mobile ordering is strongest among Gen Z and Millennials. Gen Z (47%) and Millennials (45%) are ordering more now from restaurant apps than they were three months ago compared to Gen X (30%) and Boomers (14%).
- Gamification attracts Gen Z and Millennials. Gen Z (71%) and Millennials (66%) are more likely to interact with a brand if there was a game. 32% of Gen Z and 31% of Millennials would download the app while 30% of Gen Z and 33% of Millennials would order from the app.
Survey Methodology
The survey was conducted via SurveyMonkey between August 2 – 3, 2021 among a national sample of 1,508 American adults aged 18 and older. Additional methodology can be found within the report.


